전 포스팅에서 봤듯이 prometheus는 exporter를 배포하지 않더라도 이미 많은 metric을 수집하고 있다는 것을 알 수 있었습니다.
특히 kubernetes 안에 배포된 container와 기본적인 node에 관한 metric도 수집되는 것을 알 수 있는데, 이는 kubernetes가 자체적으로 cluster 내의 모든 노드에 metric을 수집하는 cAdvisor라는 모니터링 에이전트를 배포하기 때문입니다.
cAdvisor만으로도 많은 data를 얻을 수 있지만, 이번 포스팅에서는 더 다양한 exporter를 배포하여 cAdvisor에서 수집하지 않는 metric을 추가적으로 scrape 해보도록 하겠습니다.
해당 포스팅에선 아래의 version을 사용했습니다.
kubernetes:v1.17.12
prom/prometheus:v2.20.1
prom/node-exporter:v1.0.1
quay.io/coreos/kube-state-metrics:v1.8.0
🧑🏻💻 Node-exporter
Node-exporter는 Cluster에 존재하는 노드마다 하나씩 배포되어 해당 노드에서 발생하는 metric을 수집하는 exporter입니다. Node-exporter는 노드의 cpu 사용률, memory 사용률, disk 사용률, network bandwidth와 같은 hardware 단에서 발생하는 metric을 수집하게 됩니다. 노드마다 하나씩 고유하게 배포되어야 하기 때문에 daemonset으로 배포하도록 하겠습니다.
# node-exporter-service.yaml

apiVersion: v1
kind: Service
metadata:
  annotations:
    prometheus.io/scrape: "true"
  name: node-exporter-http
  namespace: monitoring
  labels:
    app: node-exporter
spec:
  type: ClusterIP
  selector:
    app: node-exporter
  ports:
    - name: scrape
      port: 9100
      protocol: TCP
# node-exporter-daemonset.yaml
apiVersion: apps/v1
kind: DaemonSet
metadata:
name: node-exporter
namespace: monitoring
labels:
app: node-exporter
spec:
selector:
matchLabels:
app: node-exporter
template:
metadata:
labels:
app: node-exporter
spec:
hostNetwork: true
hostIPC: true
hostPID: true
containers:
- name: node-exporter
image: prom/node-exporter:v1.0.1
imagePullPolicy: IfNotPresent
args:
- --path.procfs=/host/proc
- --path.sysfs=/host/sys
resources:
requests:
cpu: 10m
memory: 100Mi
limits:
cpu: 100m
memory: 100Mi
ports:
- name: scrape
containerPort: 9100
hostPort: 9100
volumeMounts:
- mountPath: /host/proc
name: proc
readOnly: true
- mountPath: /host/sys
name: sys
readOnly: true
volumes:
- name: proc
hostPath:
path: /proc
type: ""
- name: sys
hostPath:
path: /sys
type: ""
🧑🏻💻 kube-state-metrics
kube-state-metrics는 kubernetes 클러스터 내부의 Pod가 사용 중인 리소스 metric과 네트워크 I/O, Deployments 수, Pod 수 등의 다양한 정보를 수집합니다. kube-state-metrics는 모든 node에 접근하여 해당 node의 metric을 직접 수집하는 node-exporter와는 달리, kube-state-metrics는 kubernetes가 이미 갖고 있는 데이터를 kubernetes api 서버로부터 요청하여 가져오기 때문에 cluster 내에 단 하나의 component만 배포합니다.
# kube-state-metrics-rbac.yaml

apiVersion: rbac.authorization.k8s.io/v1
kind: ClusterRoleBinding
metadata:
  name: kube-state-metrics
roleRef:
  apiGroup: rbac.authorization.k8s.io
  kind: ClusterRole
  name: kube-state-metrics
subjects:
  - kind: ServiceAccount
    name: kube-state-metrics
    namespace: monitoring
---
apiVersion: rbac.authorization.k8s.io/v1
kind: ClusterRole
metadata:
  name: kube-state-metrics
rules:
  - apiGroups:
      - ""
    resources: ["configmaps", "secrets", "nodes", "pods", "services", "resourcequotas", "replicationcontrollers", "limitranges", "persistentvolumeclaims", "persistentvolumes", "namespaces", "endpoints"]
    verbs: ["list","watch"]
  - apiGroups:
      - extensions
    resources: ["daemonsets", "deployments", "replicasets", "ingresses"]
    verbs: ["list", "watch"]
  - apiGroups:
      - apps
    resources: ["statefulsets", "daemonsets", "deployments", "replicasets"]
    verbs: ["list", "watch"]
  - apiGroups:
      - batch
    resources: ["cronjobs", "jobs"]
    verbs: ["list", "watch"]
  - apiGroups:
      - autoscaling
    resources: ["horizontalpodautoscalers"]
    verbs: ["list", "watch"]
  - apiGroups:
      - authentication.k8s.io
    resources: ["tokenreviews"]
    verbs: ["create"]
  - apiGroups:
      - authorization.k8s.io
    resources: ["subjectaccessreviews"]
    verbs: ["create"]
  - apiGroups:
      - policy
    resources: ["poddisruptionbudgets"]
    verbs: ["list", "watch"]
  - apiGroups:
      - certificates.k8s.io
    resources: ["certificatesigningrequests"]
    verbs: ["list", "watch"]
  - apiGroups:
      - storage.k8s.io
    resources: ["storageclasses", "volumeattachments"]
    verbs: ["list", "watch"]
  - apiGroups:
      - admissionregistration.k8s.io
    resources: ["mutatingwebhookconfigurations", "validatingwebhookconfigurations"]
    verbs: ["list", "watch"]
  - apiGroups:
      - networking.k8s.io
    resources: ["networkpolicies"]
    verbs: ["list", "watch"]
---
apiVersion: v1
kind: ServiceAccount
metadata:
  name: kube-state-metrics-account
  namespace: monitoring
# kube-state-metrics.yaml
apiVersion: apps/v1
kind: Deployment
metadata:
labels:
app: kube-state-metrics
name: kube-state-metrics
namespace: monitoring
spec:
replicas: 1
selector:
matchLabels:
app: kube-state-metrics
template:
metadata:
labels:
app: kube-state-metrics
spec:
containers:
- name: kube-state-metrics
image: quay.io/coreos/kube-state-metrics:v1.8.0
resources:
requests:
cpu: 500m
memory: 2Gi
limits:
cpu: 500m
memory: 2Gi
livenessProbe:
httpGet:
path: /healthz
port: 8080
initialDelaySeconds: 5
timeoutSeconds: 5
ports:
- containerPort: 8080
name: scrape
- containerPort: 8081
name: telemetry
readinessProbe:
httpGet:
path: /
port: 8081
initialDelaySeconds: 5
timeoutSeconds: 5
nodeSelector:
kubernetes.io/os: linux
serviceAccountName: kube-state-metrics-account
🧑🏻💻 Actuator (jmx-exporter)
이번엔 JVM에서 발생하는 metric을 수집하기 위해 Jmx-exporter를 사용해 보겠습니다. Jvm에서 발생되는 metric을 수집하는 방법에는 외장 jmx-exporter를 사용하는 방법과 java agent를 사용하는 방법 두 가지가 있습니다. 해당 포스팅에선 Actuator라는 java agent를 이용해서 metric을 수집해보도록 하겠습니다.
Actuator는 Spring Boot 애플리케이션에서 maven 또는 gradle을 이용해서 손쉽게 배포할 수 있습니다. 해당 예시에선 maven을 이용해서 진행해 보도록 하겠습니다.
Actuator 설정하기
먼저 아래와 같이 actuator와 micrometer를 dependencies로 추가해주도록 합니다.
그런 다음 아래와 같이 management.endpoints.web.exposure.include 옵션에 prometheus를 추가해줌으로써 metric을 prometheus 형식에 맞게 export 시켜 줄 수 있습니다. 이외에도 health도 함께 넘겨주었는데, 해당 옵션은 kubernetes에서 pod에 대한 health check를 할 때 사용하는 옵션입니다. (아래에서 다시 설명하겠습니다.)
// porm.xml

    <dependencies>
        <dependency>
            <groupId>org.springframework.boot</groupId>
            <artifactId>spring-boot-starter-actuator</artifactId>
        </dependency>
        <dependency>
            <groupId>io.micrometer</groupId>
            <artifactId>micrometer-registry-prometheus</artifactId>
        </dependency>
    </dependencies>
// application.properties
spring.application.name=noah
management.metrics.tags.application=${spring.application.name}
management.endpoints.web.exposure.include=prometheus,health
Spring Boot 배포하기
이제 본격적으로 Spring Boot 애플리케이션을 kubernetes에 배포해보도록 하겠습니다. source code는 아래와 같습니다.
해당 예시에서 사용하는 docker image는 변경되거나 삭제할 수 있으므로, source code의 형식만 눈에 익히시고, test는 다른 이미지로 하시는걸 추천드립니다.
# tomcat-deployment.yaml

apiVersion: apps/v1
kind: Deployment
metadata:
  name: noah-deploy
  namespace: default
  labels:
    app: noah
spec:
  replicas: 1
  selector:
    matchLabels:
      app: noah
  strategy:
    rollingUpdate:
      maxSurge: 25%
      maxUnavailable: 1
    type: RollingUpdate
  template:
    metadata:
      labels:
        app: noah
    spec:
      containers:
        - name: noah
          image: ooeunz/noah:0.0.1-SNAPSHOT
          imagePullPolicy: Always
          ports:
            - containerPort: 8080
              protocol: TCP
            - containerPort: 8999
              protocol: TCP
          resources:
            requests:
              cpu: 100m
              memory: 100Mi
            limits:
              cpu: 100m
              memory: 100Mi
          livenessProbe:
            httpGet:
              path: /actuator/health
              port: 8999
            initialDelaySeconds: 20
            periodSeconds: 5
          readinessProbe:
            httpGet:
              path: /actuator/health
              port: 8999
            initialDelaySeconds: 5
            periodSeconds: 5
# tomcat-service.yaml

apiVersion: v1
kind: Service
metadata:
  annotations:
    prometheus.io/scrape: "true"
    prometheus.io/port: "8999"
    prometheus.io/path: "/actuator/prometheus"
  name: noah-http
  namespace: noah-test
spec:
  selector:
    app: "noah"
  ports:
    - port: 8080
      name: application
      protocol: TCP
      targetPort: 8080
    - port: 8999
      name: scrape
      protocol: TCP
      targetPort: 8999
Scarpe 된 metric 확인하기
jmx-exporter는 기본적으로 tomcat의 8999 port를 이용해서 metric을 export 시킵니다.
따라서 service에서 8080과 8999 port를 모두 열어주도록 하겠습니다. 뿐만 아니라 jmx-exporter의 경우 "/actuator/prometheus" 라는 경로에 metric이 노출되므로 metricprometheus.io/path 역시 설정해주도록 합니다.
우리는 위에서 management.endpoints.web.exposure.include 값에 health를 함께 넣어 주었는데, 해당 옵션을 주면 "/actuator/health" 경로로 GET 요청을 보낼 경우 아래와 같은 경량 응답 값을 받을 수 있습니다. 해당 옵션을 이용하면 응답 값의 데이터 크기도 적으며, health check를 위해 따로 api를 만들지 않아도 된다는 장점이 있습니다.

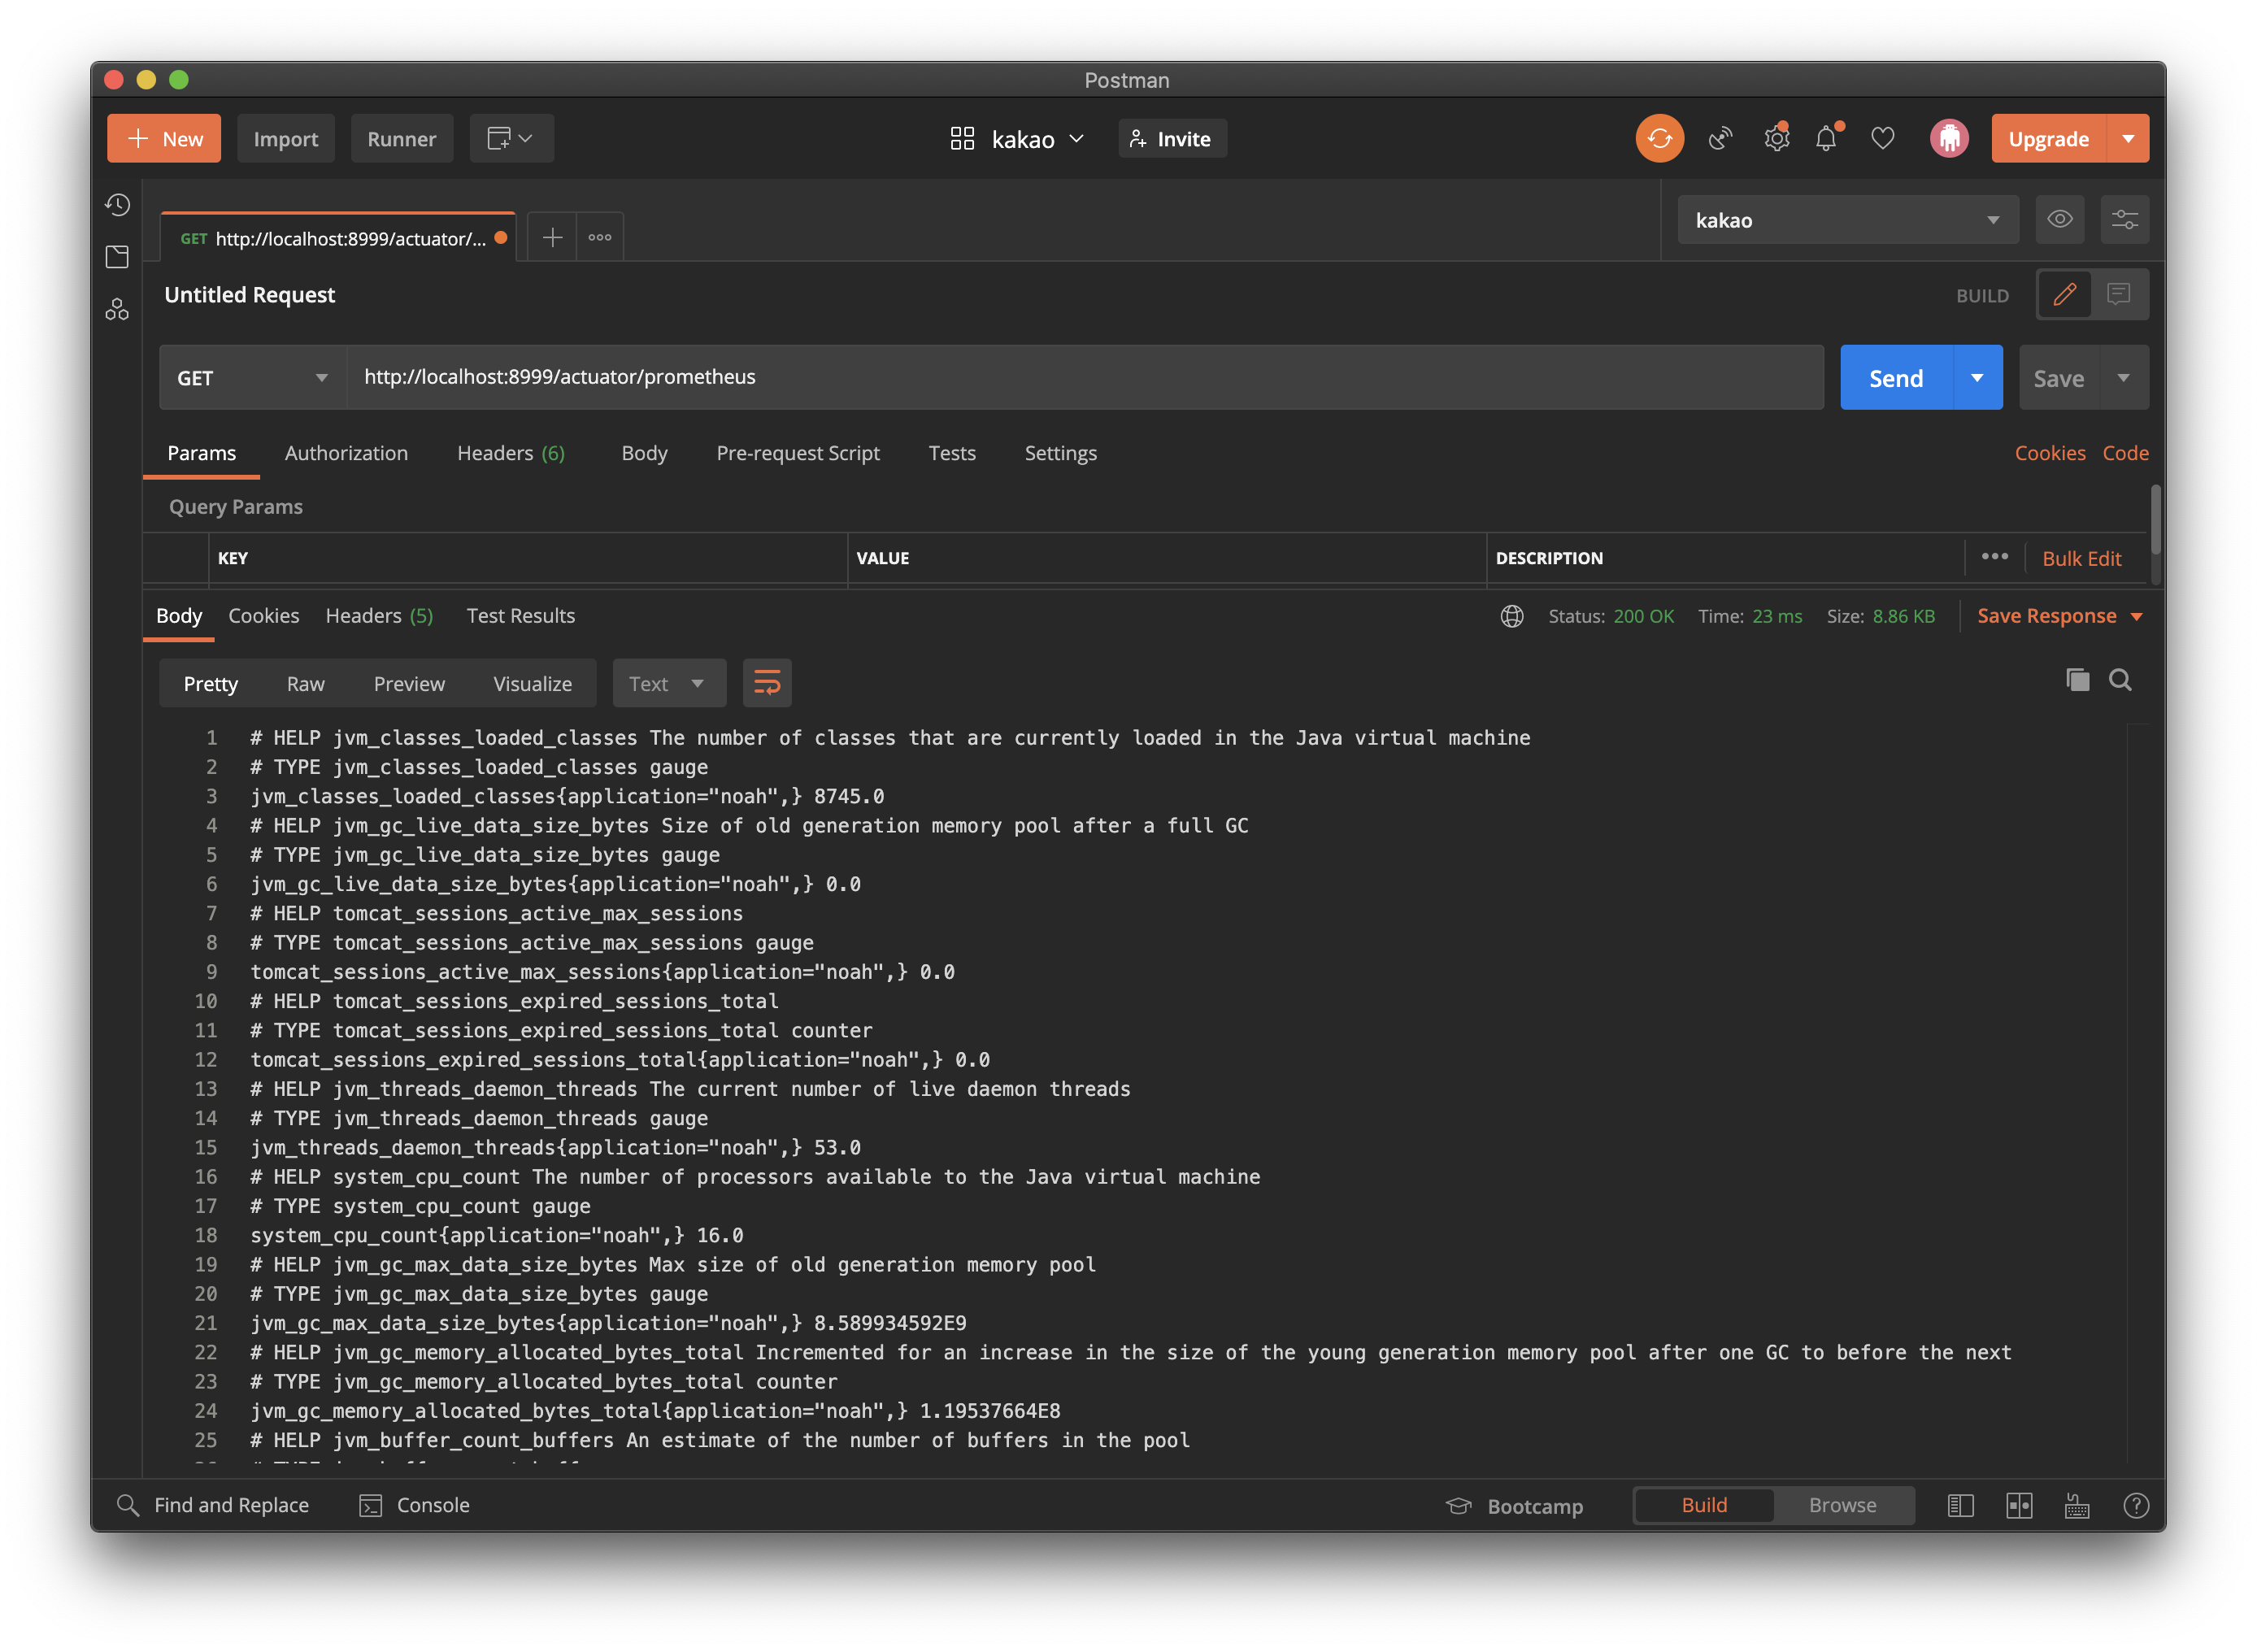
다음은 JVM에서 발생하는 metric을 확인해보도록 하겠습니다. "/actuator/prometheus" 로 GET 요청을 해보도록 합니다.
GET 요청을 보내면 JVM에서 생성되는 많은 metric이 scrape 되고 있다는 것을 알 수 있습니다.
jmx-exporter가 수집하는 metric을 살펴보면 cAdvisor와 달리 jvm안에서 발생하는 metric을 수집한다는 것을 알 수 있습니다. 대표적인 metric으로는 heap메모리의 사용률, gc 수행 시간 및 실행 수, thread 수와 같은 metric이 있습니다.
🥳 Jmx-exporter의 추가 기능
사실 jmx-exporter가 수집하는 metric은 이게 다가 아닙니다. Jmx-exporter는 Spring Boot에서 사용하는 third party library에 관하여서도 metric을 수집하는데 대표적인 라이브러리는 아래와 같습니다. (더 자세한 내용은 Spring 공식 도큐먼트를 참고합니다.)
- kafka.*
- hystrix.*
- hicaricp.*
- rabbitmq.*
- cache.*
Kafka Libray를 예로 들어보겠습니다. (kafka가 pub/sub 모델로 이루어졌다는 것 정도만 알고 읽으시면 됩니다)
대표적인 Exporter의 종류 중엔 kafka-exporter라는 exporter가 존재합니다. 해당 exporter는 kafka에 붙어서 발생하는 metric을 수집하는 exporter입니다. 하지만 kafka-exporter는 kafka broker 붙어서 발생하는 metric을 scrape 하기 때문에 broker를 subscribe 하고 있는 애플리케이션과 publish 하고 있는 애플리케이션에 관하여서는 metric을 수집할 수 없습니다. 때문에 당연히 수집하는 metric의 종류가 제한적일 수밖에 없기 때문에 추가적인 exporter가 필요할 것입니다.
jmx-exporter는 이러한 불편함을 자동화 해주는데, jmx-exporter에 굳이 따로 설정을 해주지 않더라도 애플리케이션이 kafka.* 라이브러리를 사용하고 있다면 kafka와 관련된 metric도 수집해주게 됩니다. (정말 기가 막히지 않나요...?)
🤔 어떻게 따로 설정하지 않았음에도 metric을 수집할 수 있는 걸까?
"jmx-exporter가 좋은 건 알겠어. 하지만 어떻게 kafka와 관련된 export 설정을 해주지 않았는데도 metric을 수집할 수 있는 거지?"라는 의문이 드실 것 같습니다. (궁금하지 않으셨다면 죄송합니다...ㅎ)
이와 관련된 의문은 micrometer의 소스 코드를 뜯어보면 알 수 있는데, 대표적으로 kafka consumer 라이브러리의 metric을 수집하는 KafkaConsumerMetrics라는 Class를 살펴보겠습니다. JMX는 기본적으로 Spring에 존재하는 모든 bean을 jmx MBeanServer라는 곳에 등록하게 됩니다. 여기서 노출되는 metric을 KafkaConsumerMetrics (micrometer v1.1.0부터 지원하고 custom metric을 등록하는 MeterBinder interface를 구현한 클래스)의 객체가 수집하여 custom metric으로 등록하기 때문에 따로 metric과 관련된 export 설정을 해주지 않아도 됩니다.
이때 지정된 메트릭 이름은 kafka 0.11.0 버전에 지정된 이름을 기반으로 한다고 합니다.
🧑🏻💻 그 밖의 다양한 exporter
사실 해당 포스팅에서 다룬 exporter는 정말 극히 일부입니다. 이외에도 다양한 exporter들이 open source로 존재합니다. 오픈소스로 공개된 exporter가 없다면 직접 custom exporter를 구현할 수도 있지만, 웬만하면 누군가 만들어둔 exporter가 존재하니까 서치 해보시길 추천드립니다. 아래는 대표적으로 사용되는 exporter의 종류입니다.
- node-exporter
- cAdvisor (docker-container)
- mysql-exporter
- wmi-exporter (window server)
- mysql-exporter
- postgresql-exporter
- redis-exporter
- mongodb-exporter
- elasticsearch-exporter
- kafka-exporter
여기까지 exporter를 이용하여 더 다양한 metric을 수집하는 방법에 대해서 살펴보았습니다.
오늘도 이 포스팅 쓰는 데 온종일이 걸렸네요. 😭
다음 포스팅에선 클러스터에 문제가 발생했을 경우 alertmanager를 이용해 알림을 전송하는 방법을 알아보도록 하겠습니다.
마지막으로 해당 포스팅에서 사용된 source code는 아래의 github에서 확인 하실 수 있습니다.
ooeunz/blog-code
Contribute to ooeunz/blog-code development by creating an account on GitHub.
github.com
'DevOps > Prometheus' 카테고리의 다른 글
| [Prometheus] kubernetes 환경에 prometheus 구축하기 (2) | 2021.02.12 |
|---|